Moble App Adoption Rates: Better at Scale or RCT?

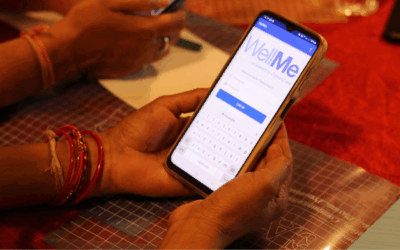
Since early 2016, Dimagi has worked with a consortium of partners to deploy a mobile app built on CommCare to over 50,000 frontline workers (FLWs) across five priority states in India. This represented a roughly 100x scale-up of the randomized controlled trial (RCT) in Bihar whose strikingly positive results motivated this larger effort. This large-scale project is also an order of magnitude larger than any other comprehensive digital solution for FLWs that we are aware of, including our own CommCare deployments.

The challenges of going from RCT to Scale

One major concern loomed over our team for the two years we worked on the project: even if the partnership could work through the enormous technical, logistical, and stakeholder-related challenges to equip and train thousands of  FLWs with a digital solution would the app be adopted? Many global development interventions (digital or otherwise) that are proven effective in well-funded RCTs are never successfully launched at scale. Small projects are often successful in large part due to small, motivated, tight-knit teams that put in the work to make them happen. As we scaled this project, one key challenge we faced was the decreased contact our implementation team could have with each end user. For example, the implementation team would not be able to individually reach out to all 50,000 of the FLWs working on this project.

How does current uptake compare with other projects?

There is an independent research study underway to assess the impact of this application on the FLWs and their clients, which should generate results next year. However, as we wait for the results of this study, an important prerequisite for project success that we can analyze now is how actively the users engage with the application so far.

So how does the current user activity look?

Six months into the launch, adoption results are surprising and encouraging!

By almost any measure, our large-scale deployment has noticeably better adoption rates when compared to most other small-scale CommCare projects. Below, are the nitty-gritty details.

We started with a list of every CommCare project with at least 50 users, and for each of those projects we determined the percentage of users that submit data in each of the first six months after they start using CommCare. A user had to submit data in all six months to qualify. As shown in the table below, the 15 projects that scored highest on this metric have rates between 77% and 91% of their users continuously submitting data for their first six months. Given the complexity of rolling out a digital solution this number is not too bad!

Turning now to the large-scale project, 90% of the users submitted data (at least one form) for each of the first six months [see footnote 1]. This places it among the top 1% (3 of 307) of projects we have ever seen! By comparison, the pilot in Bihar, scores about 65% on this metric.

total users ever submitted data total forms submitted by all users median forms per month per user num users started 6+ months ago percent users that submitted data for each of first six months
103 157,745 158 103 91.26%
72 600,600 199 72 90.28%
52,291 58,205,400 155 38,454 89.95%
89 191,490 62 89 88.76%
64 111,892 58 63 87.30%
56 82507 133 44 86.36%
150 455,518 288 150 84.00%
254 812,290 101 254 83.86%
57 122,746 134 51 82.35%
107 819,462 245 107 82.24%
104 62895 36 103 80.58%
73 16,330 16 73 79.45%
293 652,688 39 293 78.50%
113 386569 131 113 76.99%
86 736,400 226 86 76.74%

One reason for the higher rate of continuous usage could be that the app has some simple forms that are meant to be submitted each day. Thus, it is possible that submitting one form in a month on this large-scale project might be less significant than submitting one form per month on the other projects we analyzed. We did further analysis on the large-scale project and determined that 78% of the FLWs submitted 15 or more forms for each of their first six months, which would put it in the top 5% of the 307 projects we analyzed (even if we held this project to a 15 form per month standard and all other projects to a one form per month standard). Furthermore, 89% of the users who submitted 15 forms in any month also submitted 15 forms in each of their first six months [see footnote 2].

How is this possible?

There are a variety of reasons why consistent app usage could be higher for this project than it is on many of our smaller-scale projects. We considered several possibilities below:

  • Previous experience: The rollout of this app benefited from learnings from the RCT and other smaller projects. The training schedule included a series of trainings for the FLWs that were based on the implementing partner’s experience in the pilot. The consortium also built and deployed apps for the supervisors of the FLWs, and set up a help desk to troubleshoot technical problems. These additional support channels might have improved the overall experience for FLWs by allowing them to quickly overcome any challenges using the app that might have otherwise deterred app usage.
  • Leadership from the government: A significant factor in the high uptake in usage can likely be attributed to the fact that the project is championed by the concerned Ministry and senior leadership in the Government of India. This senior level commitment and the focus on ensuring a successful sustainable rollout has perhaps had a cascading positive impact along the entire chain from the Central Government on the States, by the States on the Districts and all the way down to the end user to remain active on the application. The project also includes a robust reporting dashboard, with health and nutrition data made highly visible. Decision makers across different tiers of the government are actively monitoring the dashboard and data reports of active and inactive users, encouraging FLWs to sustain active usage.
  • User enthusiasm: Given the enormous momentum around this project, the FLWs may feel especially excited to be part of this national drive. Users are also working with one of the best applications Dimagi has ever designed (in collaboration with various stakeholders), built with thought and care to map to their workflow and address their pain points.

What’s ahead?

So far, we only have a sample of one for projects of this scale anywhere in the world. And we are only six months into this project’s deployment. Given the newness of this project and the fact that we will not get the results of the study analyzing its impact until next year, it is far too early to reach any conclusions about the success of large scale digital services deployments yet. At the same time, it is interesting and worth celebrating the success of the initial launch!

As this project shifts into the next phase, there will be many new opportunities and challenges to deliver value. We expect that the key to continued usage and ultimate impact will rest on how well the system delivers value to all stakeholders government decision makers, users and the communities they serve.


  1. Note that this is computed on the 38,000 users who started six or more months ago. Another 12,000 users started in May 2017 or later.
  2. To be more specific, there were 38,454 users who submitted at least one form in March or April of 2017. Of these, 30,173 submitted 15 or more forms for each of their first six months, 3,628 submitted 15 forms in at least 1 month but not in every month, and 4,653 never submitted 15 forms in any month.  

Share

Tags

Similar Articles

The World's Most Powerful Mobile Data Collection Platform

Start a FREE 30-day CommCare trial today. No credit card required.

Get Started

Learn More

Get the latest news delivered
straight to your inbox