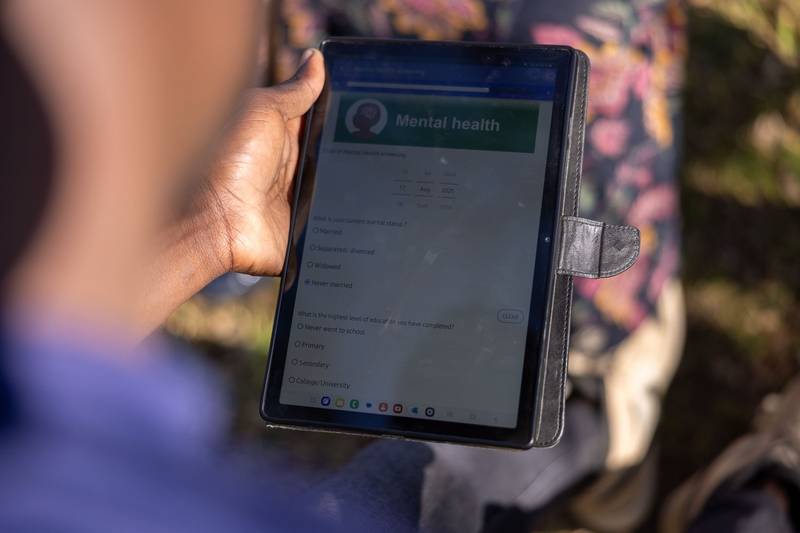
Introducing the Under the Data Tree blog series
Welcome to Dimagi’s Under the Data Tree blog series!
Our objective is to share insights that we glean from analyzing millions of forms that have been submitted to our cloud server from hundreds of projects around the globe. We believe this data contains a wealth of information about the most effective way to implement CommCare or other mobile technology for frontline workers in resource-poor settings. Each blog will report on an investigation into one particular topic, using CommCare data from a wide range of projects.
The current list of blogs is:
- How quickly do frontline workers adopt mobile technology?
- Is it unusual for a user’s activity level to change quickly?
- Does technology matter in CommCare projects?
- Frontline Worker Performance Distribution – Does it follow a bell curve?
- How long do programs use CommCare for?
- How to visualize a CommCare project’s history
- Is it goodbye or see you later? When users stop using CommCare
- Activity vs. scale
These blogs will assume some basic familiarity with CommCare, but we’ll introduce a few general terms here that are frequently used in our blogs. CommCare’s cloud server supports many CommCare projects. A project refers to a frontline program, such as a program that is trying to improve maternal and child health or address food insecurity. Each project utilizes one or more CommCare apps that are configured to support the needs of that project. Apps usually run on a smartphone or feature phone, though they can also run on the web or over SMS.
Each app is accessed by a number of users. Typically, a user is a frontline worker, such as a community health worker who provides outreach to pregnant women and children. An important feature of CommCare is that it supports case management, allowing users to register, update, and close cases in their app. A case is usually a user’s client, e.g., a pregnant woman who is supported by a CommCare user. In November 2014 alone, 6,515 users from around the world registered over 175,000 new cases.
While using CommCare, the user fills out forms which eventually get submitted to the CommCare cloud server. As shown in Figure 1 below, the cumulative number of forms submitted by CommCare users as of November 2014 was just over 9.2 million. Some apps are structured so that several forms (each designed to collect unique bits of information on a case) are filled out by a user during a single encounter with a case. A visit to a case is defined as one or more of these forms being submitted consecutively by a user for that specific case in one day.
Figure 1: Cumulative number of forms submitted by CommCare users: March 2010 – December 2014
Metadata from all submitted forms are stored in the Dimagi Data Platform; this includes date and time stamps for when forms were started, ended, and received by the cloud server. These form metadata are then linked to their respective cases, users, apps and projects, allowing us to quantify important aspects of CommCare activity such as number of form submissions, frequency of visits to cases, case registration rates, etc. This series of blogs is predominantly based on analyses of CommCare metadata, with the goal of describing the role of mobile technology in projects all around the world.
Share
Tags
Similar Articles
A Day in the Life Of - Wouter Vink, Director of Solutions Delivery, Solutions Division
The Q&A provides insights into the Solutions Delivery team at Dimagi, including A Day in the Life of Wouter Vink, Director of Solutions Delivery, Solutions Division, their consulting role, unique challenges, remote collaboration, career advice, and excitement for the future.
Staff Blog
May 26, 2023